Tutorial: Create a Custom Integration (StackPack)
Goal
As a DevOps developer, you want to customize SUSE® Observability to monitor applications you have deployed.
|
This page is about developing a custom integration. For information on installing an already built integration, see Install or uninstall a StackPack. |
Prerequisites
-
Access to a running SUSE® Observability instance. For installation options, see Installing SUSE® Observability.
-
OpenTelemetry Demo telemetry in SUSE® Observability. You can follow the tutorial with your own telemetry, but the examples below assume the demo setup from Demo environment.
-
The SUSE® Observability CLI configured for that instance
Scaffold a StackPack
The scaffold subcommand creates a StackPack project from a template. The default template comes from stackpack-templates.
sts stackpack scaffold --name my-stackpack --display-name "My StackPack"
...
...

✅ ✓ Scaffold complete!

Next steps:
1. Review the generated files in: ./my-stackpack
2. Check the ./my-stackpack/README.md for instructions on what to do next.
The generated project includes a stackpack.yaml manifest, StackPack settings, and resources used in the StackPack UI. For details about the project layout, see StackPack project structure.
Test deploy the StackPack
Use test-deploy for the development loop. It packages, uploads, and installs or upgrades the StackPack with a test suffix.
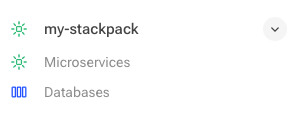
sts stackpack test-deploy -d . --yesRun the command again after changing the StackPack. Review the generated topology, metrics, monitors, and presentation changes in the SUSE® Observability UI. The scaffolded StackPack creates a main menu group my-stackpack.
|
The scaffolded StackPack adds a main menu group with submenu items, but the component overviews backing the sub menu items only show meaningful data after matching telemetry is ingested. For a demo setup that sends OpenTelemetry Demo data to SUSE® Observability, see Demo environment. |
Customize the StackPack
Start with the generated README.md and the files under settings/. The generic template demonstrates the main extension points:
-
OpenTelemetry component mappings: OpenTelemetry mappings
-
OpenTelemetry relation mappings: OpenTelemetry mapping concepts
-
Component overview and highlight pages: Presentation concepts
-
Presentation schema details: Presentation schema
-
Monitors and remediation hints: Monitor schema
-
Monitor debugging: Using the CLI for monitors
-
Metrics and their presentation: Presentation metrics
-
StackPack file structure and CLI commands: StackPack reference
For public example StackPacks, see contrib-stackpacks.
Example customizations
The scaffolded StackPack already contains component mappings, relation mappings, presentations, and a cart latency monitor for the OpenTelemetry Demo. The following changes build on those files.
Add a second monitor
The template includes settings/monitors.sty, which monitors the cart service’s add-to-cart latency. Add a second monitor in a new file to show when the cart service is receiving add-to-cart traffic.
This monitor is intentionally simple and demo-oriented: it goes to DEVIATING when the cart service’s add-to-cart request rate is greater than zero. That makes it easy to verify that the monitor was installed, that the query returns data, and that the result binds to cart service instances. For a production monitor, use a threshold that represents a real problem, such as a high error ratio or high p95 latency.
Create settings/monitors/cart-traffic-monitor.sty:
nodes:
  - _type: Monitor
    function: urn:stackpack:common:monitor-function:threshold
    arguments:
      comparator: GT
      failureState: DEVIATING
      metric:
        aliasTemplate: Add-to-cart request rate
        query: >-
          sum by (service_namespace, service_name, service_instance_id)
          (rate(app_cart_add_item_latency_seconds_count{service_name=~"cart|cartservice"}[5m]))
        unit: reqps
      threshold: 0.0
      titleTemplate: Cart traffic
      urnTemplate: "urn:opentelemetry:namespace/${service_namespace}:service/${service_name}:serviceInstance/${service_instance_id}"
    description: |-
      Demo monitor for cart traffic. When the cart service receives add-to-cart
      requests, the matching cart service instance goes to a Deviating state.
    identifier: urn:stackpack:my-stackpack:shared:monitor:cart-traffic
    intervalSeconds: 30
    name: Cart traffic (Demo)
    remediationHint: |-
      This demo monitor intentionally triggers when cart receives add-to-cart traffic.
      For production use, replace it with a monitor for errors, latency, or another real symptom.
    status: ENABLED
    tags:
      - cart
      - traffic
Deploy and verify the change:
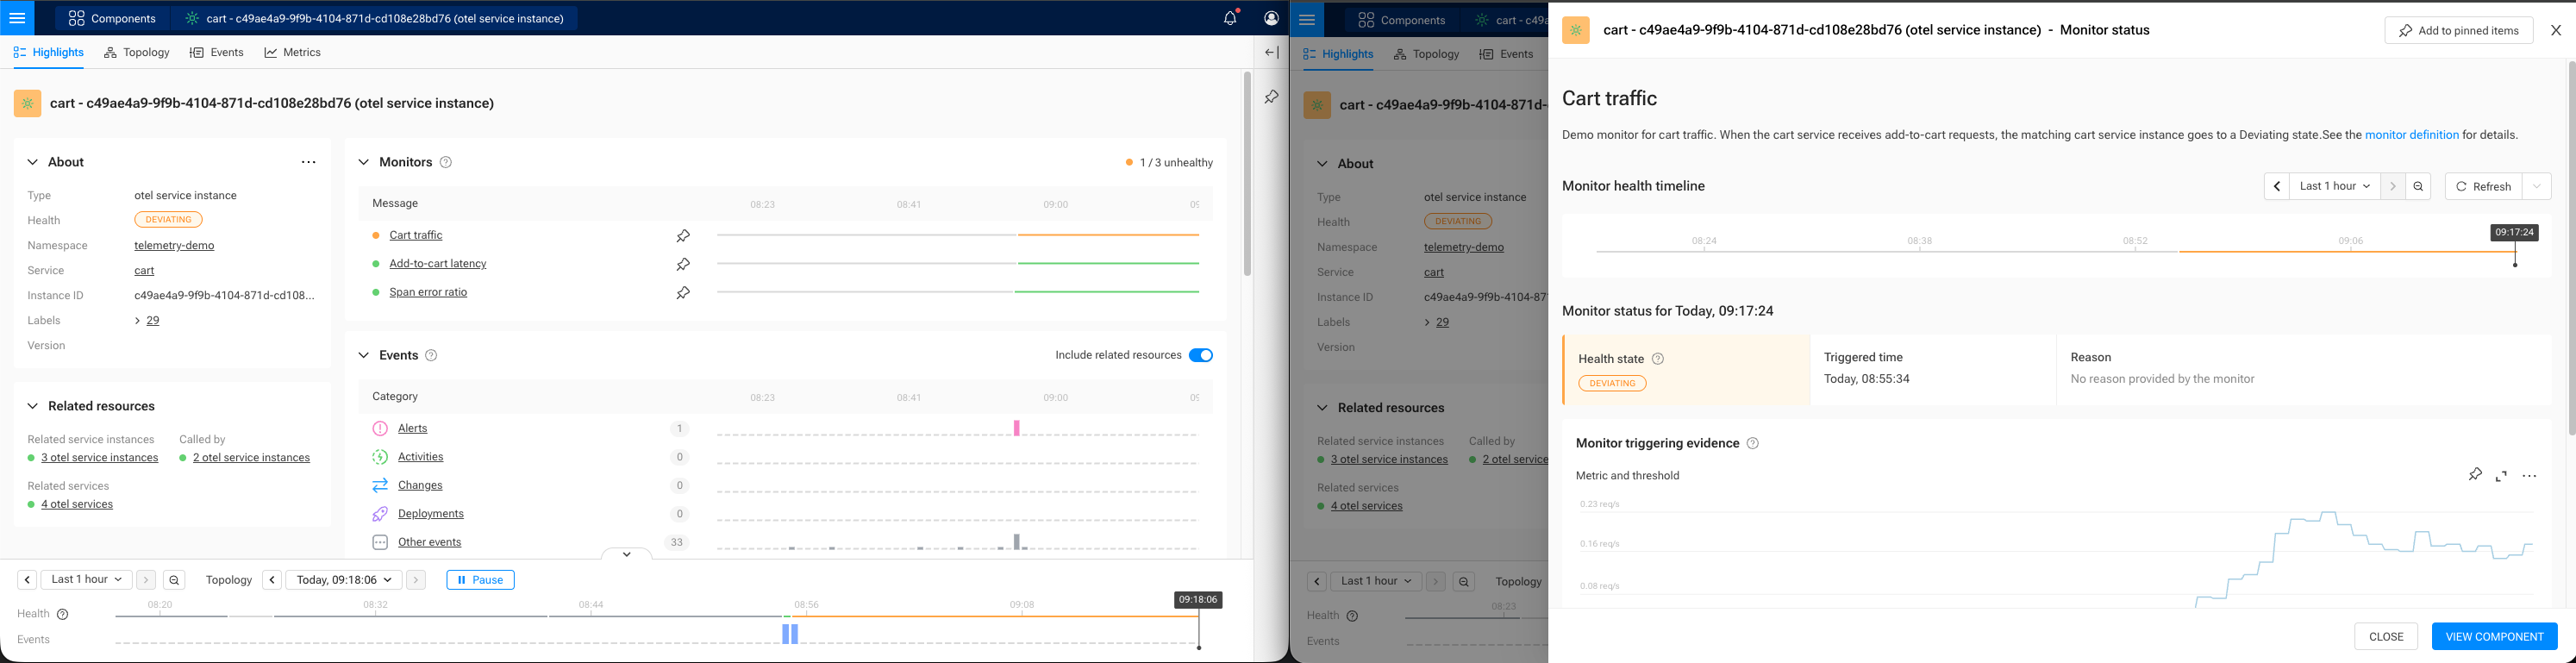
sts stackpack test-deploy -d . --yesIn the SUSE® Observability UI, open a cart service instance and check the monitor result on the component.
You should see a Cart traffic monitor in a DEVIATING state.
Add telemetry data to the checkout highlight
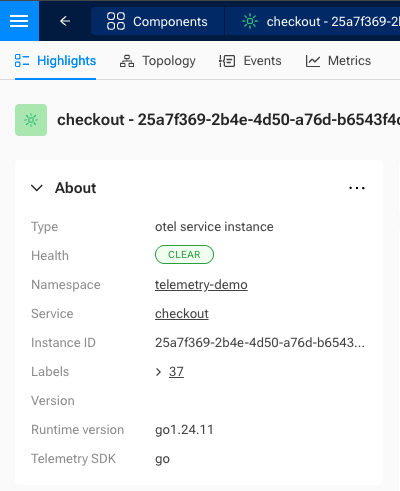
The file settings/presentations/checkout.sty already adds a checkout-specific Runtime version field from the process.runtime.version telemetry attribute. Add another field that shows the OpenTelemetry SDK language.
Open settings/presentations/checkout.sty and add this item under presentation.highlight.fields:
          - fieldId: "telemetry-sdk-language"
            title: "Telemetry SDK"
            order: 55.0
            projection:
              _type: TextProjection
              value: "tags.singleValue('telemetry.sdk.language')"
Deploy the change:
sts stackpack test-deploy -d . --yesOpen a checkout service instance in the SUSE® Observability UI. The highlight page should now include the Telemetry SDK field.
Package and upload the StackPack
When the StackPack is ready to share with another SUSE® Observability instance, package and upload it:
sts stackpack package -d .
sts stackpack upload --file ./my-stackpack-0.0.1.sts
Uploading makes the StackPack version available in SUSE® Observability. It does not install the StackPack instance. Install it from the StackPacks UI, or use the CLI commands described in StackPack CLI reference.