Schema and reference for Monitors
Overview
This page describes the schemas for a Monitor, along with detailed explanations of constructs, expression syntax and semantics.
Schema for Monitor
A monitor specifies how often a monitor function should run and with which arguments.
_type: "Monitor"
name: string
description?: string
function: string
arguments:
  <dependent on monitor function>
intervalSeconds: integer
remediationHint?: string
status?: "ENABLED" | "DISABLED"       # defaults to "DISABLED"
tags:
  <key>: <value>
identifier?: string-
_type: SUSE® Observability needs to know this is a monitor so, value always needs to beMonitor -
name: The name of the monitor -
description: A description of the monitor. -
function: A reference to the monitor function that will execute the monitor. -
intervalSeconds: The interval at which the monitor executes. For regular real-time metric 30 seconds is advised. For longer-running analytical metric queries a bigger interval is recommended. -
remediationHint: A description of what the user can do when the monitor fails. The format is markdown, with optionally use of handlebars variables to customize the hint based on time series or other data (see remediation guide). -
status: Either"DISABLED"or"ENABLED". Determines whether the monitor will run or not. -
tags: Add tags to the monitor to help organize them in the monitors overview of your SUSE® Observability instance, http://your-instance/#/monitors -
identifier: An identifier of the formurn:stackpack:<stackpack-name>:monitor:<monitor-short-name>which uniquely identifies the monitor when updating its configuration.
Monitor Functions
Threshold
Triggers a health state when a given threshold is exceeded for a specified metric query. Different thresholds can be set on particular resources with the help of annotations.
function: {{ get "urn:stackpack:common:monitor-function:threshold" }}
arguments:
  metric:
    query: string
    unit: string
    aliasTemplate: string
  comparator: GTE | GT | LTE | LT     # how to compare metric value to threshold
  threshold: double
  failureState: CRITICAL | DEVIATING | UNKNOWN
  urnTemplate: string
titleTemplate: string-
query: A PromQL query. Use the metric explorer of your SUSE® Observability instance, http://your-instance/#/metrics, and use it to construct query for the metric of interest. -
unit: The unit of the values in the time series returned by the query or queries, used to render the Y-axis of the chart. See the supported units reference for all units. -
aliasTemplate: An alias for time series in the metric chart. This is a template that can substitute labels from the time series using the${my_label}placeholder. -
comparator: Choose one of LTE/LT/GTE/GT to compare the threshold against the metric. Time series for which<metric> <comparator> <threshold>holds true will produce the failure state. -
threshold: A numeric threshold to compare against. -
failureState: Either "CRITICAL" or "DEVIATING". "CRITICAL" will show as read in SUSE® Observability and "DEVIATING" as orange, to denote different severity. -
urnTemplate: A template to construct the urn of the component a result of the monitor will be bound to. -
titleTemplate: A title for the result of a monitor. Because multiple monitor results can bind to the same component, it’s possible to substitute time series labels using the${my_label}placeholder.
Derived State
Derives its state from the dependencies of the components which health state is based on observations. It produces the most critical state of the top-most dependencies. For details, see the Derived State Monitors page.
function: {{ get "urn:stackpack:common:monitor-function:derived-state-monitor" }}
arguments:
componentTypes: string-
componentTypes: The component types that contribute to derived states. Specified as a single string of,(comma) separated values
Topological Threshold
Triggers a health state when a given threshold is exceeded for a specified metric query. The metric query can reference the name, tags and properties from the components returned by the topology query. Different thresholds can be set on particular resources with the help of annotations.
function: {{ get "urn:stackpack:common:monitor-function:topological-threshold"  }}
arguments:
  queries:
    topologyQuery: string
    promqlQuery: string
    aliasTemplate: string
    unit: string
  comparator: GTE | GT | LTE | LT     # how to compare metric value to threshold
  threshold: double
  failureState: CRITICAL | DEVIATING | UNKNOWN
titleTemplate: string-
queries: The queries to execute-
topologyQuery: STQL query to select components -
promqlQuery: PromQL query that can use labels and properties of components to select time series -
unit: The unit of the values in the time series returned by the query or queries, used to render the Y-axis of the chart. See the supported units reference for all units. -
aliasTemplate: An alias for time series in the metric chart. This is a template that can substitute labels from the time series using the${my_label}placeholder.
-
-
comparator: Choose one of LTE/LT/GTE/GT to compare the threshold against the metric. Time series for which<metric> <comparator> <threshold>holds true will produce the failure state. -
threshold: A numeric threshold to compare against. -
failureState: Either "CRITICAL" or "DEVIATING". "CRITICAL" will show as read in SUSE® Observability and "DEVIATING" as orange, to denote different severity. -
titleTemplate: A title for the result of a monitor. Because multiple monitor results can bind to the same component, it’s possible to substitute time series labels using the${my_label}placeholder.
Dynamic Threshold
Alerts when the current value is outside the predicted baseline interval, which is dynamically calculated based on historical data, taking into account weekly and daily seasonal patterns. This monitor function is only available when the Autonomous Anomaly Detector stackpack is installed.
For details, see the Dynamic Threshold Monitors page.
function: {{ get "urn:stackpack:aad-v2:shared:monitor-function:dt" }}
arguments:
  telemetryQuery:
    query: string
    unit: string
    aliasTemplate: string
  topologyQuery: string
  falsePositiveRate: float
  checkWindowMinutes: integer
  historicWindowMinutes: integer
  historySizeWeeks: 1 | 2 | 3 (integer)
  includePreviousDay: boolean
removeTrend: boolean-
telemetryQuery: telemetry to evaluate-
query: PromQL query that is used for baselining and anomaly detection -
unit: The unit of the values in the time series returned by the query or queries, used to render the Y-axis of the chart. See the supported units reference for all units. -
aliasTemplate: An alias for time series in the metric chart. This is a template that can substitute labels from the time series using the${my_label}placeholder.
-
-
topologyQuery: STQL query to select components -
falsePositiveRate: say!!float 1e-8- the sensitivity of the monitor to deviating behavior. A lower value suppresses more (false) positives but may also lead to false negatives (unnoticed anomalies). -
checkWindowMinutes: say10minutes - the check window needs to be balanced between quick alerting (small values) and correctly identified anomalies (high values). A handful of data points works well in practice. -
historicWindowMinutes: say120(2 hours) - bracketed around the current time, but then one or more weeks ago - so from 1 hour before the current time to 1 hour after. Also the 2 hours before the check window are used. The dynamic threshold monitor compares the distribution of this historic data with the data points in the check window. -
historySizeWeeks: say2- the number of weeks that data is taken from for historic context. Can be1,2or3. -
removeTrend: for metrics that have trend behavior (say, number of requests), such that the absolute value differs from week to week, this trend (the average value) can be accounted for. -
includePreviousDay: typicallyfalse- for metrics that do not have a weekly but only a daily pattern, this allows the use of more recent data
PromQL interpolation
When a Topological Threshold or Dynamic Threshold monitor function is used, the PromQL query is interpolated. Example:
the_metric{namespace="${tags.namespace}",ip="${properties.ip_address}"}For each component that matches the topology query, these variables are available:
| Variable | Type | Description |
|---|---|---|
name |
string |
The name of the component |
type |
string |
The type of the component |
layer |
string |
The layer of the component |
domain |
string |
The domain of the component |
tags |
map<string,string> |
Labels of the component, in key-value pairs |
properties |
map<string,dyn> |
Properties of the component |
Bind monitor results to components
The results of a monitor need to be bound to components in SUSE® Observability, to be visible and usable. The result of a monitor is bound to a component using the component identifiers. Each component in SUSE® Observability has one or more identifiers that uniquely identify the component. To bind a result of a monitor to a component, it’s required to provide the urnTemplate. The urnTemplate substitutes the labels in the time series of the monitor result into the template, producing an identifier matching a component. This is best illustrated with the example:
The metric that is used in this example is the kubernetes_state_deployment_replicas_available metric. Run the metric in the metric explorer to observe what labels are available on the time series:
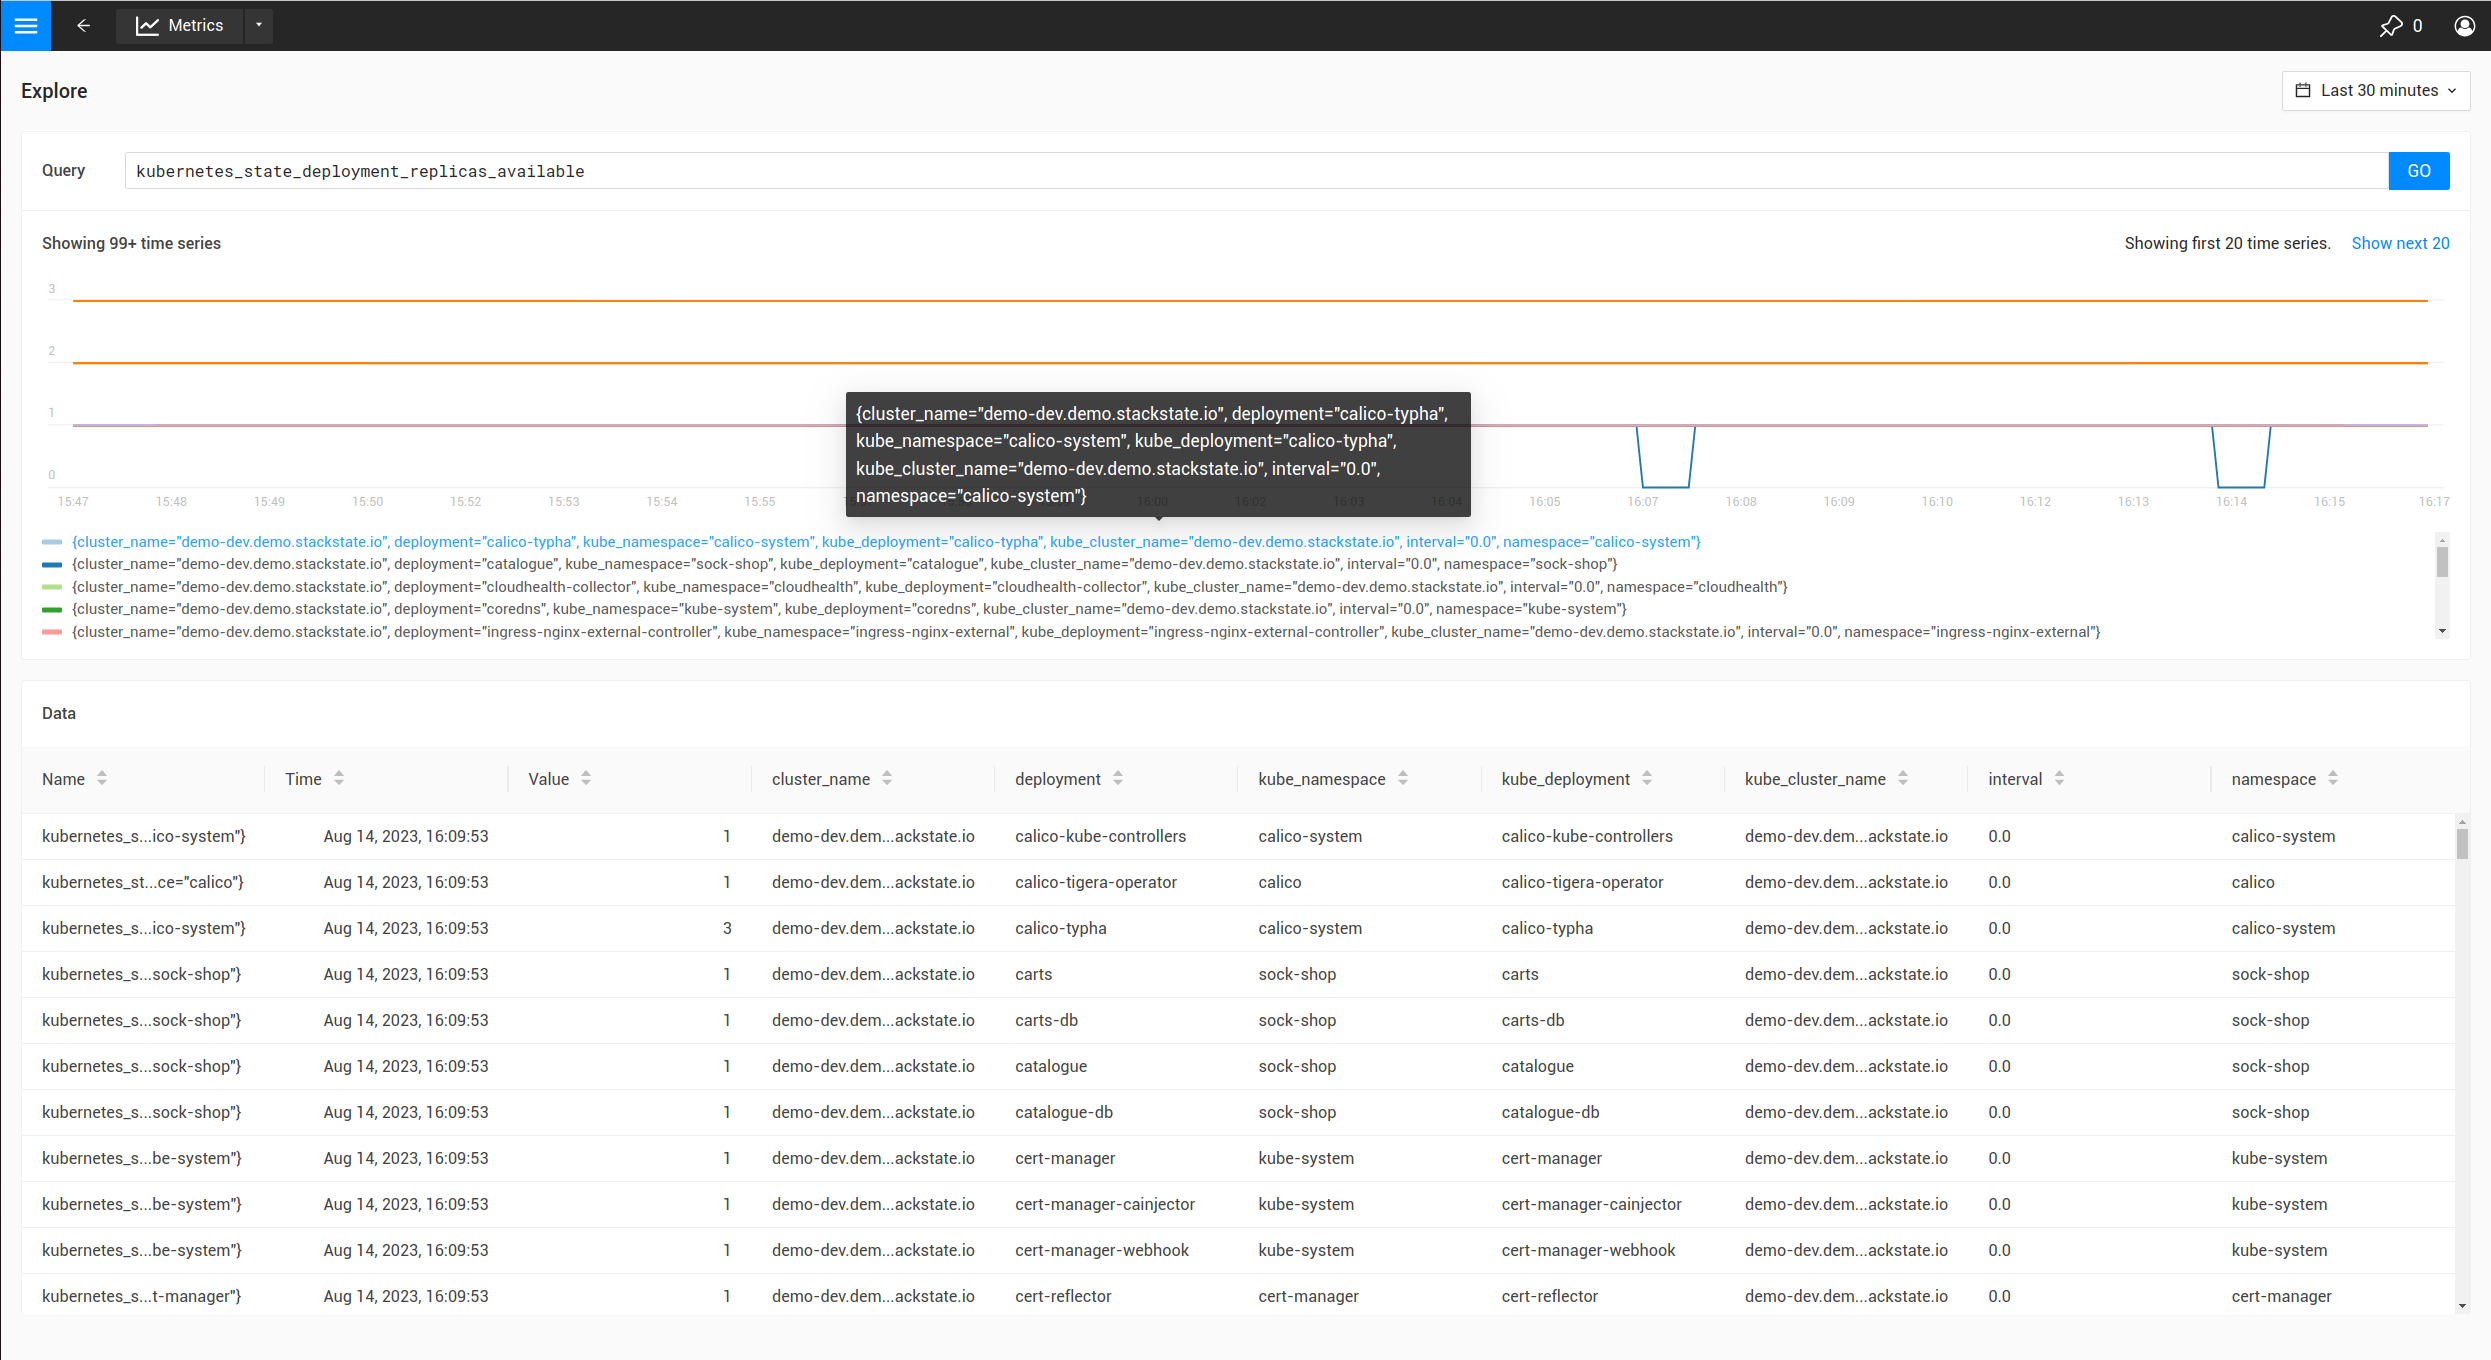
In the above table, it is shown the metric has labels like cluster_name, namespace and deployment.
Because the metric is observed on deployments, it is most logical to bind the monitor results to deployment components. To do this, it is required to understand how the identifiers for deployments are constructed:
-
In the UI, navigate to the
deploymentsview and select a single deployment. -
Open the
Topologyview, and click the deployment component. -
When expanding the
Propertiesin the right panel of the screen, the identifiers show after hovering as shown below:
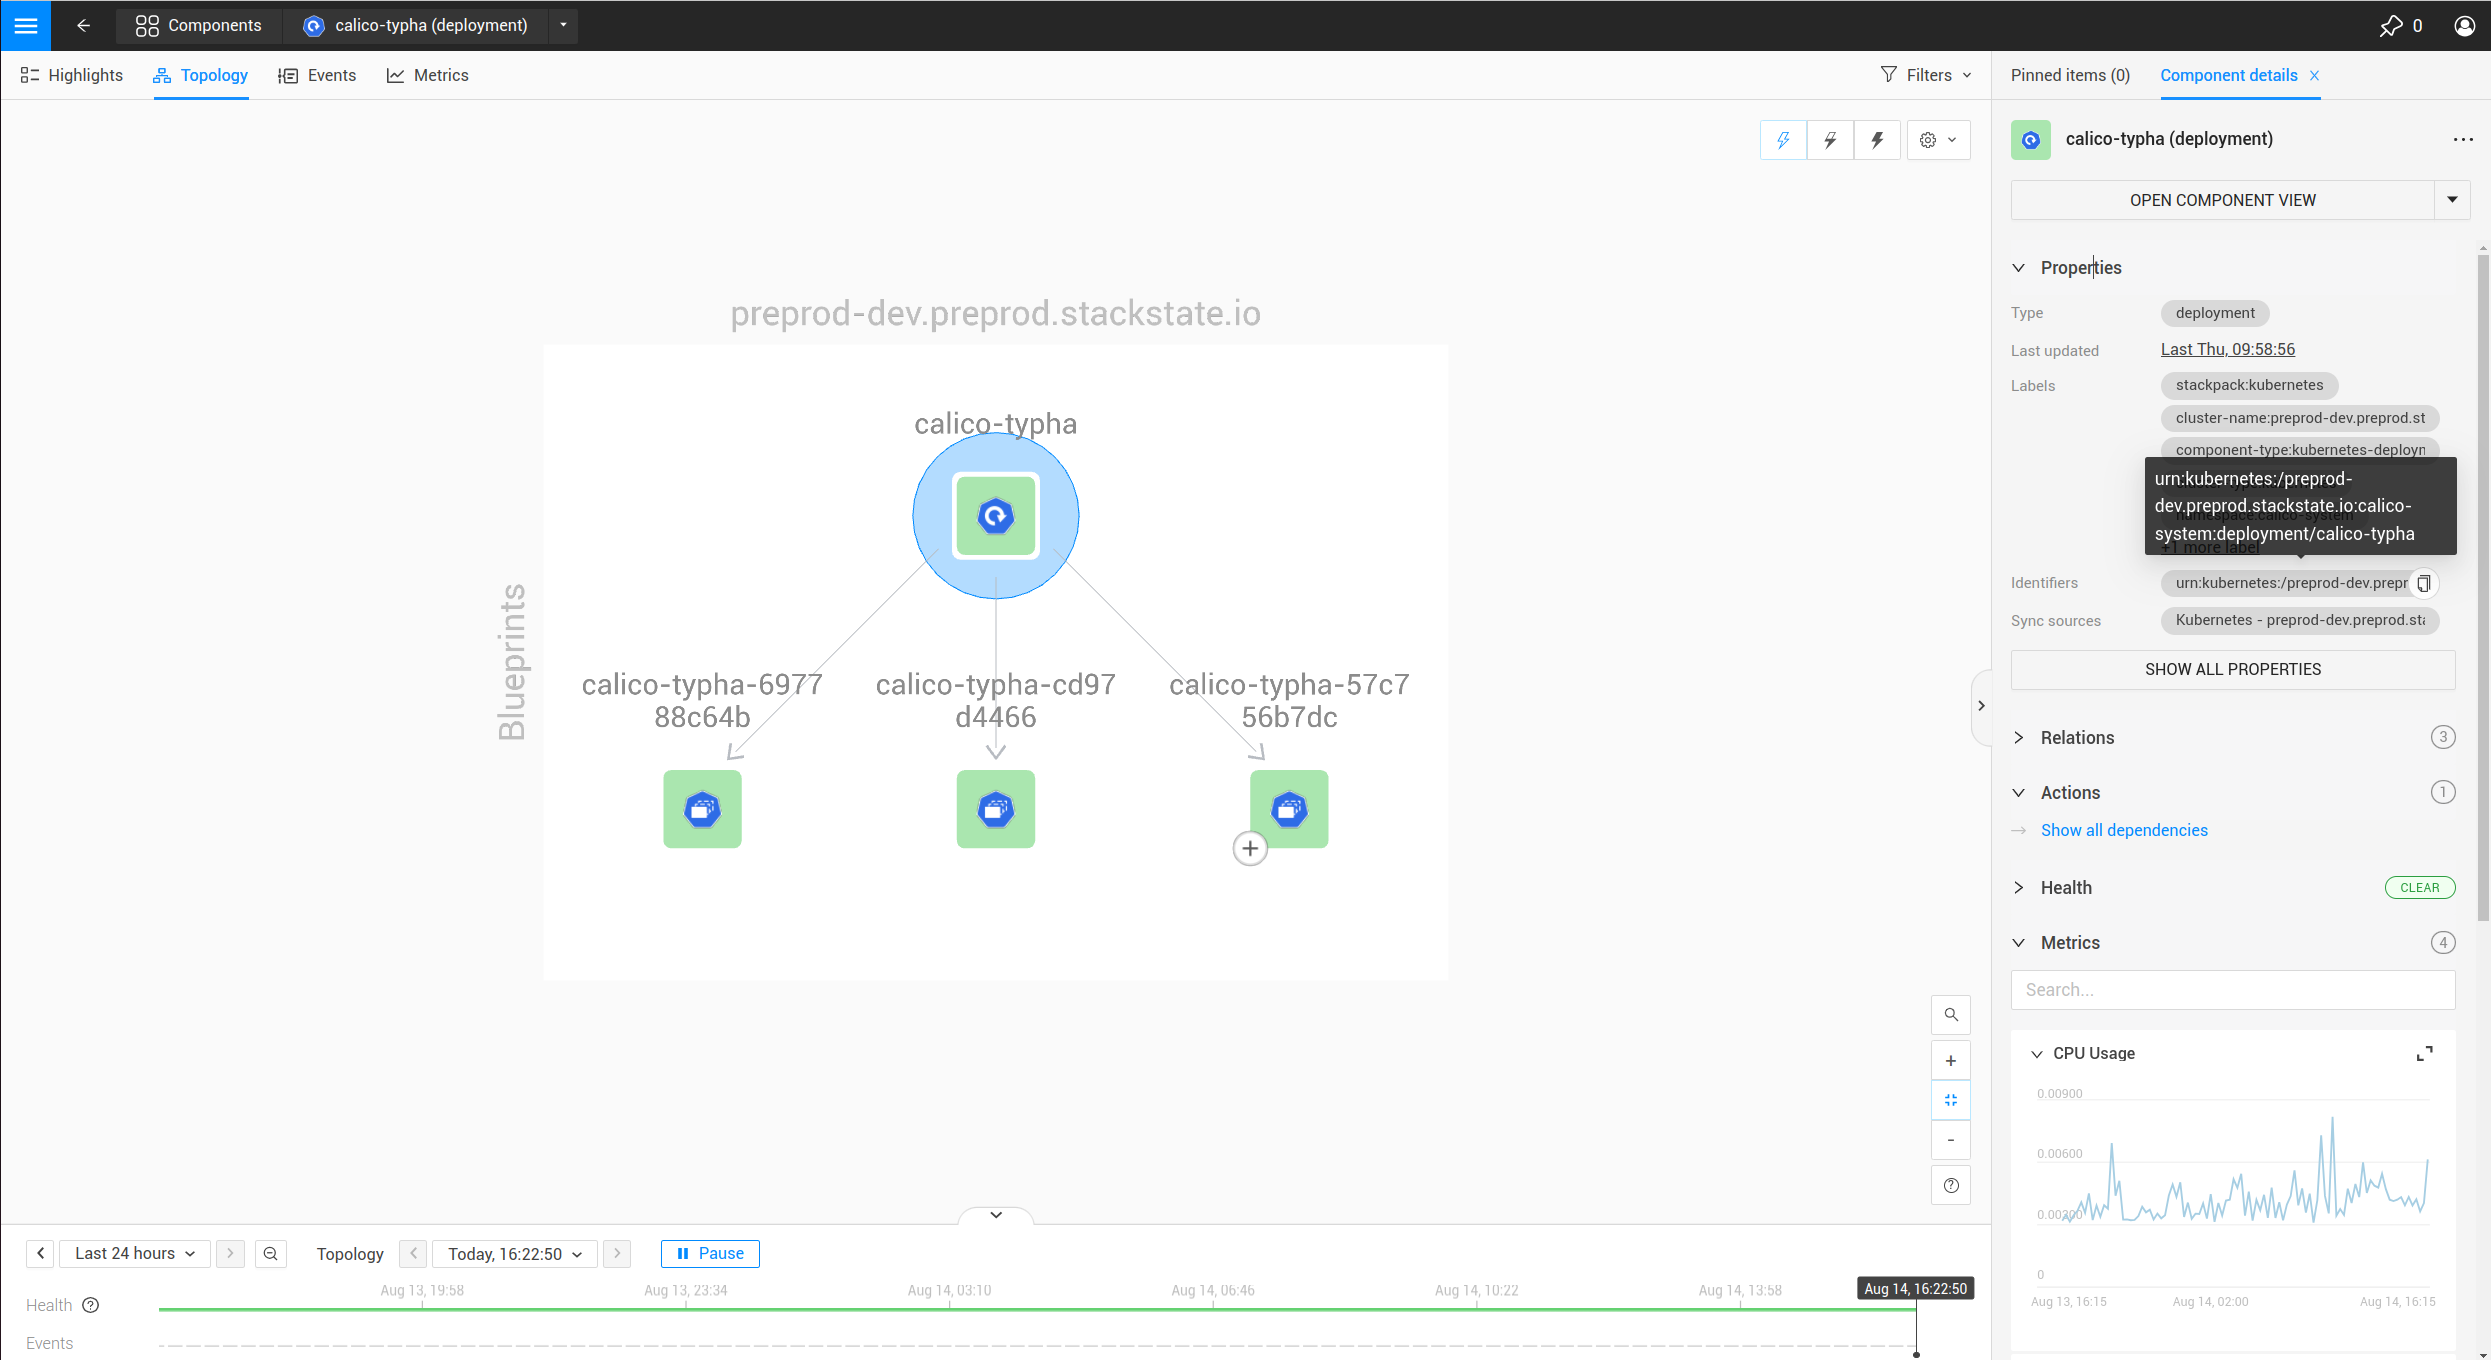
The identifier is shown as urn:kubernetes:/preprod-dev.preprod.stackstate.io:calico-system:deployment/calico-typha. This shows that the identifier is constructed based on the cluster name, namespace and deployment name. Knowing this, it is now possible to construct the urnTemplate:
  ...
  urnTemplate: "urn:kubernetes:/${cluster_name}:${namespace}:deployment/${deployment}"
  ...
To verify whether the urnTemplate is correct, is explained further below.